It already happened for 80% of humanity
154 countries now have fewer children per woman and longer lives than the United States had in 1960. This is not a theory. It is an accomplished fact.
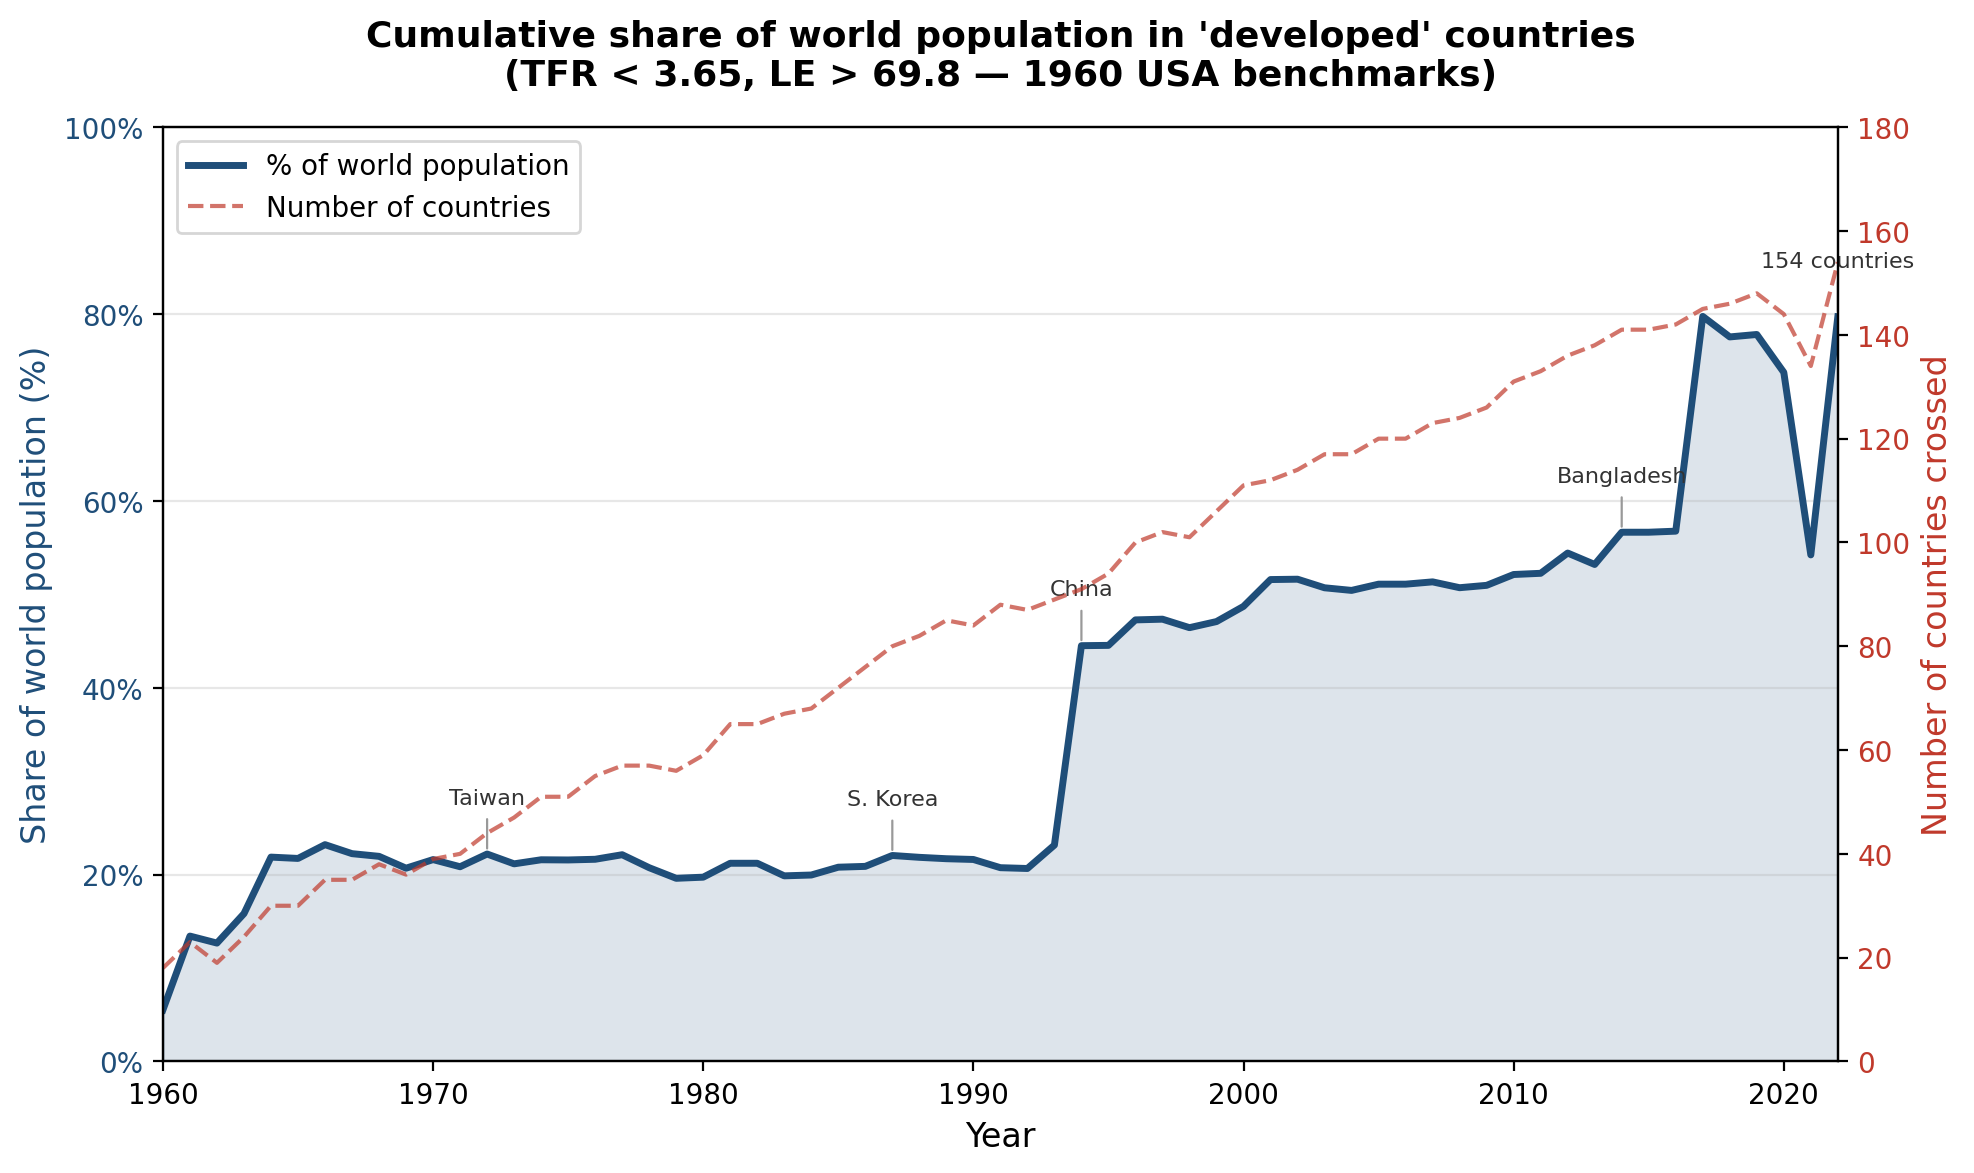
The slow climb from 1960 to 1993 is countries expanding education gradually. The vertical jump in 1994 is China — which reached both benchmarks after three decades of educational expansion. By 2001, half of humanity had crossed. The remaining 20% is concentrated in sub-Saharan Africa, with Pakistan, Afghanistan, and Yemen as the largest exceptions.
Education predicts the future. Income does not.
Income appears to predict development because education drives income. Remove education's contribution, and income predicts nothing. On every outcome tested.
The test: take each country's income, remove the part that education explains, and use what's left to predict outcomes 25 years later. If income matters on its own, the remainder should still predict. It doesn't.
expectancy
per woman
education
survival
Each country compared only to its own past, 130+ countries, 1960–2015. Income measured after removing education's contribution.
Income's numbers are so small they could be zero — no meaningful predictive power.
These numbers come from comparing each country to itself over time — not comparing rich countries to poor ones. The method controls for everything permanent about a country: its geography, culture, colonial history, institutions. What's left is change over time. And the change is driven by education.
Income appears to matter because education makes countries richer. But the part of income that has nothing to do with education predicts nothing about the future — not how long people live, not how many children women have, not the next generation's education, not child survival. Income is downstream. Education is the cause.
This holds at every education level (primary, lower secondary, upper secondary), every time lag (15 to 30 years), and with girls' education specifically. Educated mothers are even stronger predictors than the population average — the mechanism runs through families, not economies.
Education lasts for generations. Income doesn't.
How far into the future does each variable predict? Education's signal persists across 100 years — four generations. Income fades within 25 years.
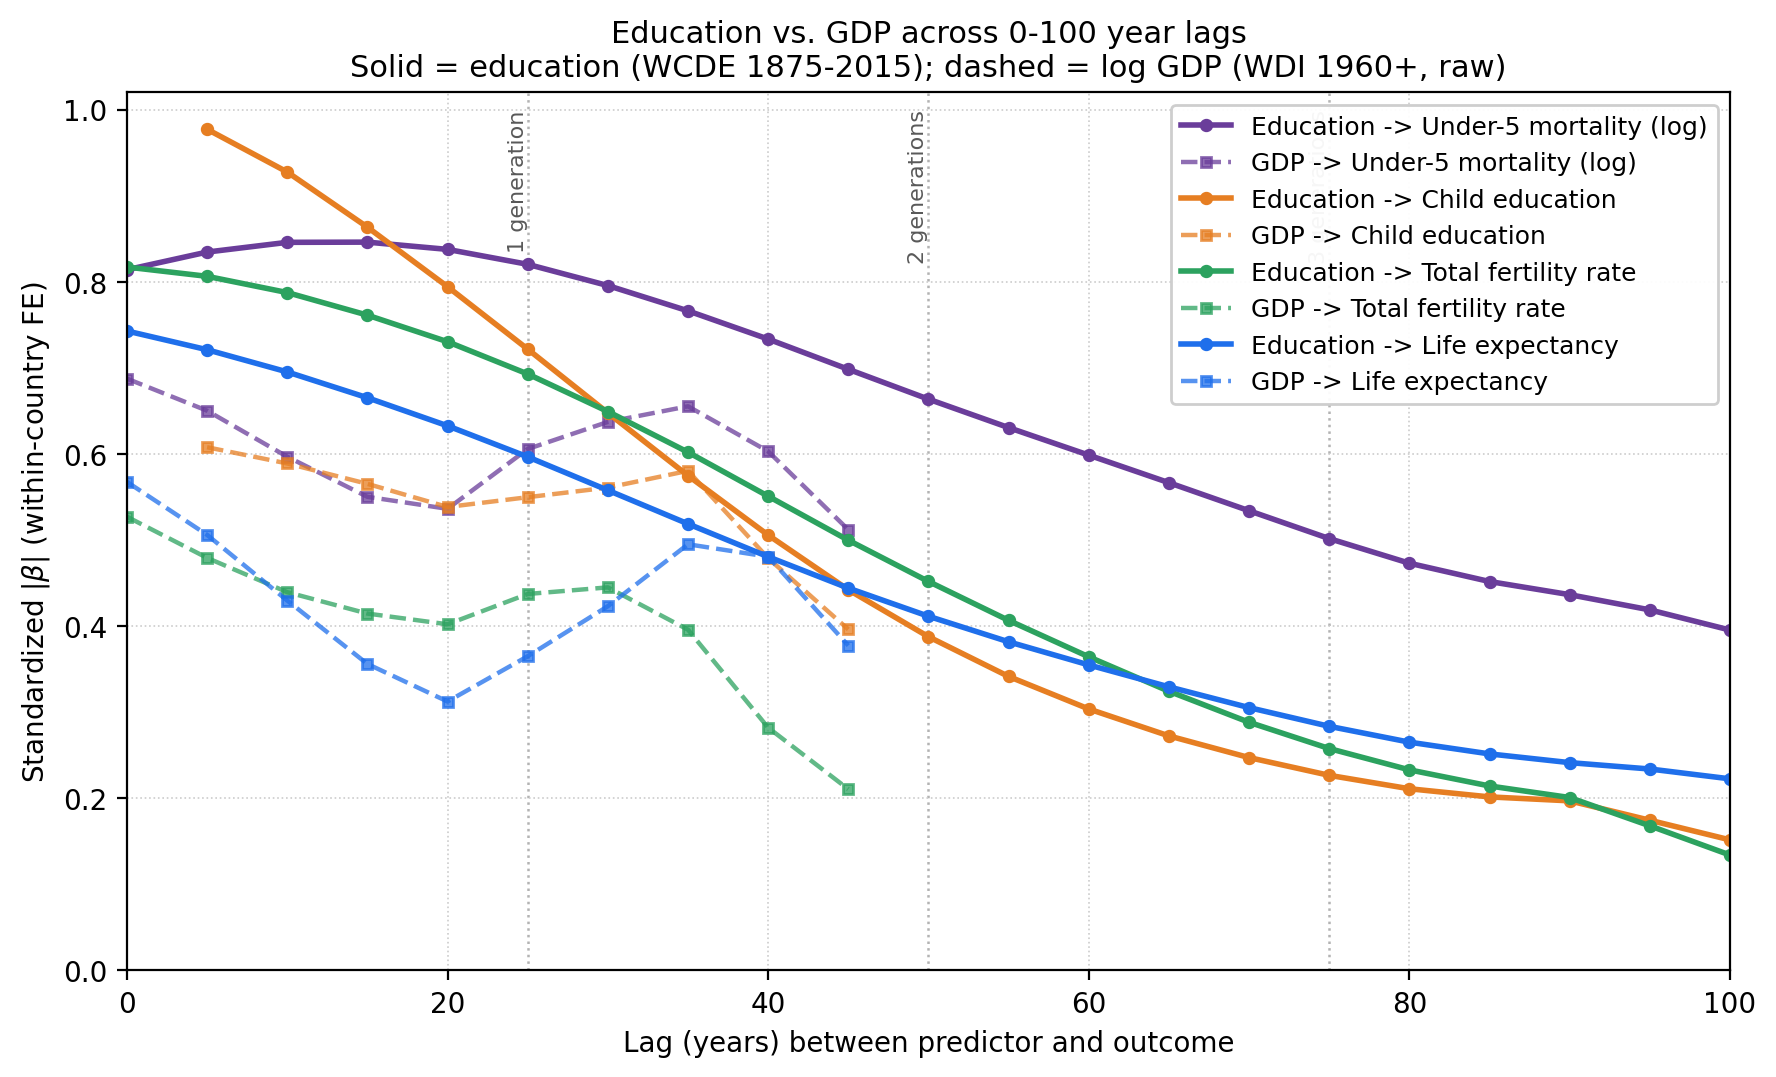
The decay is smooth — not stepped at 25-year intervals — because real populations have continuous age structure. People are of all ages at all times. Education enters the population as successive cohorts complete schooling, and the household decisions that produce development outcomes are exercised by adults across their entire lifetimes. The smooth curve is the signature of a continuous generational process, not a discrete 25-year pulse.
Before about 1960, income did not vary much between countries — nearly everyone earned roughly $400–600 per person per year. There is no hidden income signal to find. But education did vary: some countries had been building schools for centuries. A great-great-grandparent's school completion in 1915 still predicts their great-great-grandchild's child-survival outcomes in 2015 — a century later, through three intervening households.
If income caused life expectancy, its predictive power would persist at longer lags — just like education's does. Instead, it fades immediately. Income moves with life expectancy in the present, but doesn't cause it. Education does.
Education never goes backwards
In every country, in every period, children are at least as educated as their parents. The gains compound. They do not depreciate.
This is not a statistical pattern — it reflects biology. Humans have the longest childhood of any species: roughly 18 years of learning from parents. Educated parents transmit what they know to their children. That transmission is embedded in the parent-child relationship, not in government budgets or institutions. You cannot take it away by cutting a budget or collapsing an economy.
Among countries still expanding education, each generation doesn't just match the previous one — it exceeds it. Below 20% parental completion, each percentage point of parental education produces 2.9 percentage points in the next generation. The state adds reach beyond what households transmit alone.
If education were just drifting upward on its own, each generation would match the previous one — not exceed it. The amplification factor would be 1.0 or less. It is 2.9. Something is actively pushing it higher: the state building schools on top of what parents transmit.
The crash test: income wiped out, education untouched
The Asian Financial Crisis of 1997–98 wiped out income across five countries overnight. What happened to education? Nothing. It kept going.
This is the cleanest income-removal test in the data. Income was abruptly wiped out — not gradually, not by policy choice. Education was untouched at every level: lower secondary, upper secondary, and college. Thailand actually accelerated through the crisis.
Why? Because education is embodied in people, not stored in budgets. An economic crisis can empty a bank account. It cannot un-educate a mother.
The decisive test: what happens when you remove each variable?
If something is truly the cause, removing it should break the outcome. If it's not the cause, removing it should leave the outcome intact.
Remove income
Remove government provision
Remove education
Remove security
The asymmetry is structural: income is stored in banks and can be wiped out. Government programmes depend on budgets and can be cut. Education is stored in people. You cannot take it away.
The one dataset disagreement, and what the mechanism says about it
Two independent reconstructions of historical education data (WCDE v3 and Barro-Lee v3.0) agree on every country in the 185-country panel except fifteen — the Soviet republics. WCDE reports Kazakhstan at 94% lower-secondary completion in 1970; Barro-Lee reports 49%. Latvia 99% vs 57%. Russia 95% vs 73%. The gap is roughly 40 percentage points on average, all in the same direction.
Under the paper's mechanism, a 95% secondary-completion country should produce a fertility trajectory indistinguishable from Spain's and a child-mortality trajectory indistinguishable from Korea's within a generation. The Soviet republics did neither. Central Asian TFR trajectories sat on top of Iran's and Turkey's for six decades. Iran's under-5 mortality overtook Kazakhstan's by 2010 — Iran, whose reported secondary completion in 1970 was 22% against Kazakhstan's 94%. If the gap had been real, this reversal would be impossible.
The anomaly is not socialism: Warsaw Pact states and Yugoslavia (which used their own national statistical offices) pass the phenotype-consistency test under Barro-Lee. It is specifically Goskomstat — one reporting office, one era, fifteen countries.
The rerun. Excluding the fifteen Soviet republics from the 185-country headline panel produces a cleaner estimate, not a weaker one. The parental-education coefficient rises from 0.483 to 0.538. Life-expectancy forward-prediction R² rises from 0.350 to 0.366. Under-5 mortality R² rises from 0.635 to 0.659. Every coefficient moves upward. Inflated credentials were attenuating the paper's signal, not producing it.
Reconciliation with Hanushek. The other thing the Soviet case does is identify where test-score measures come from. Hanushek’s HLO score for today's 15-year-olds, regressed on their parents’ lower-secondary completion 25 years ago, gives R²=0.52 across 77 countries. The peak R² against education sits not at lag zero (today's schools) but at lag 10–25 years (the parental generation). At lag 60 (the great-grandparent generation), R² is still 0.49. Hanushek's test scores are not an alternative framework. They are the paper's completion measure integrated across three generations of parental transmission.
The horse race partitions exactly as the biology predicts: primary-completion quantity drives TFR (β_z=−0.64, t=−7.4); cognitive-depth quality drives U-5 mortality (β_z=−0.70, t=−7.6) and life expectancy (β_z=+0.83, t=+7.7). Fertility is a threshold decision that runs on completion even where schooling is shallow. Child survival and adult longevity require cognitive depth and do not respond where credentials are hollow. Hollow education is not education, but exposure still matters for TFR.
Full treatment: Chapter 9 (Data Credibility: The Goskomstat Anomaly) in Education of Humanity: On the Convergence of Nations. Analysis scripts: ussr_exclusion_panel.py, which_edu_measure_is_correct.py, hanushek_horse_race_comprehensive.py, hlo_vs_education_lag_sweep.py.
The mechanism in one paragraph
The state educates the first generation. Educated mothers have fewer children, and nearly all of them survive. Fewer children means more resources per child. More resources means more education. Educated parents send their children to school — the process continues on its own. The state creates the education; families make it permanent. Health, income, fewer children, and women's empowerment are downstream effects — they are what educated people produce through millions of household decisions, roughly 25 years after the education happens.