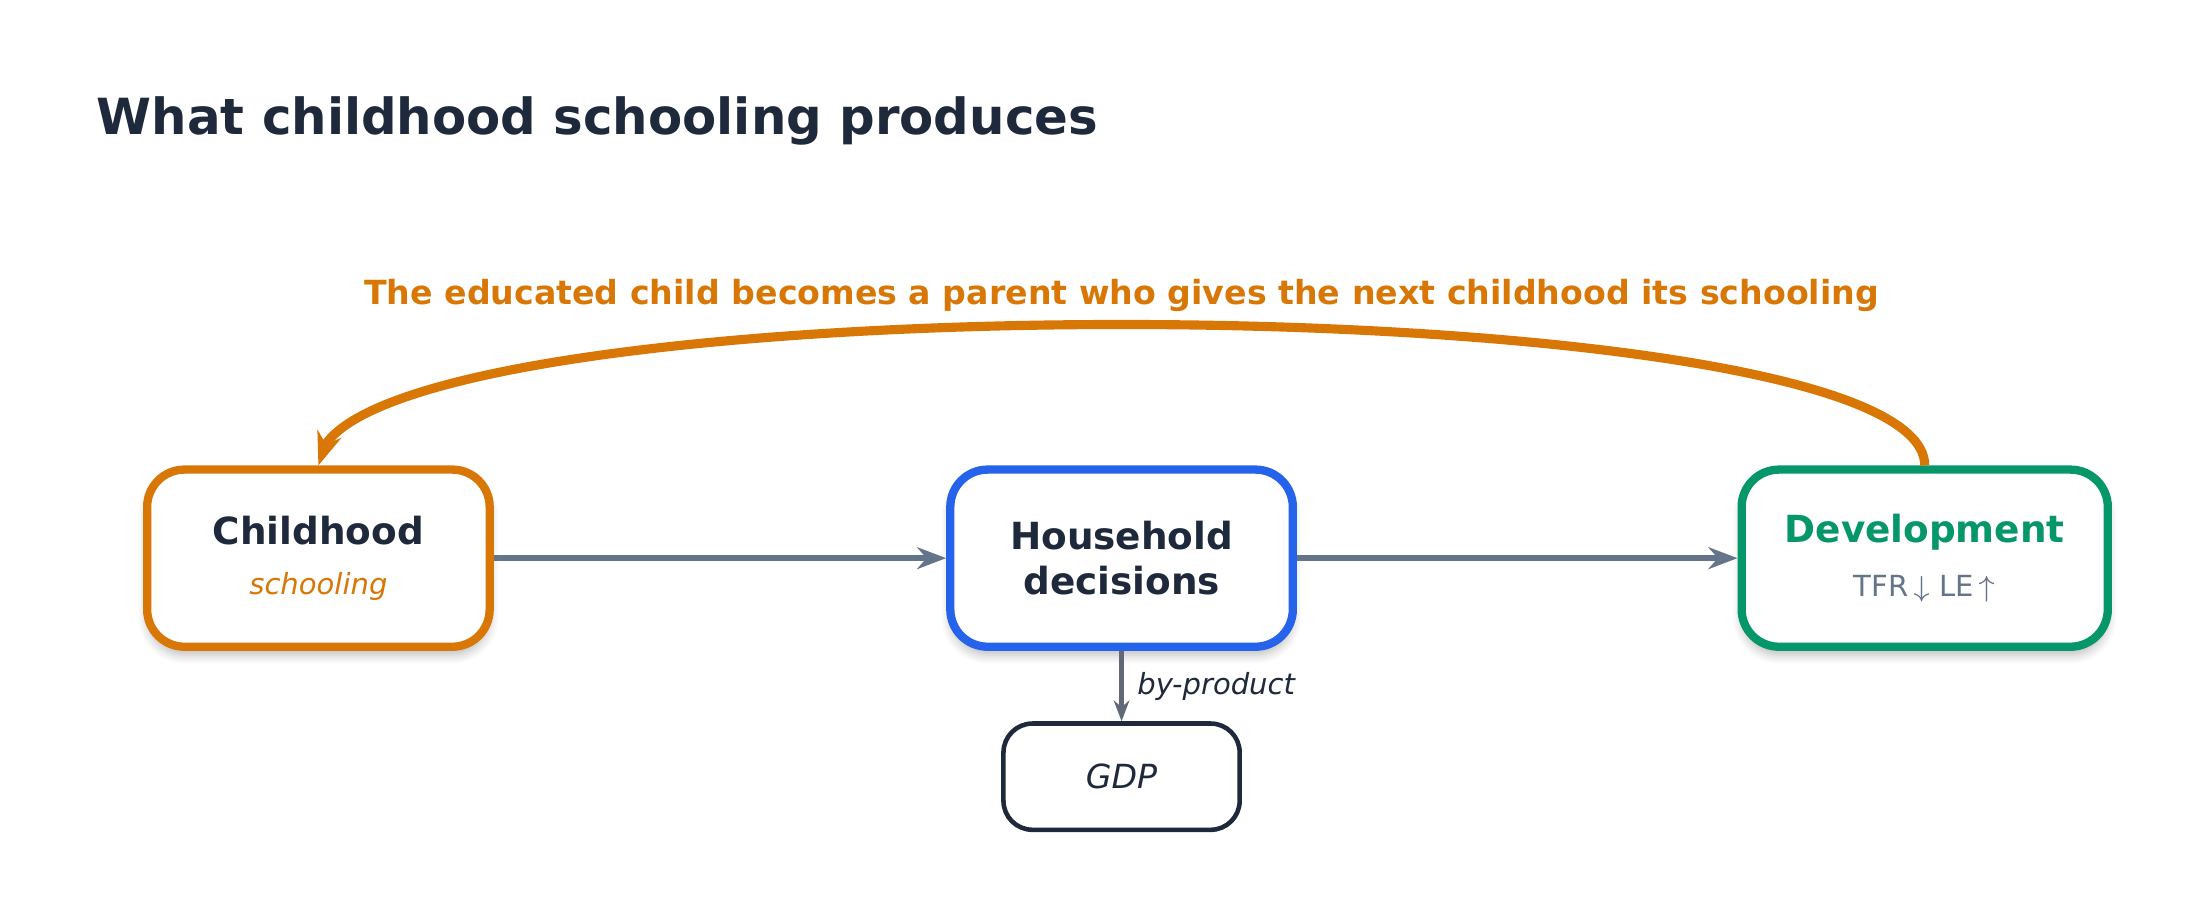
What carries it forward
Education carries development — income is what it produces
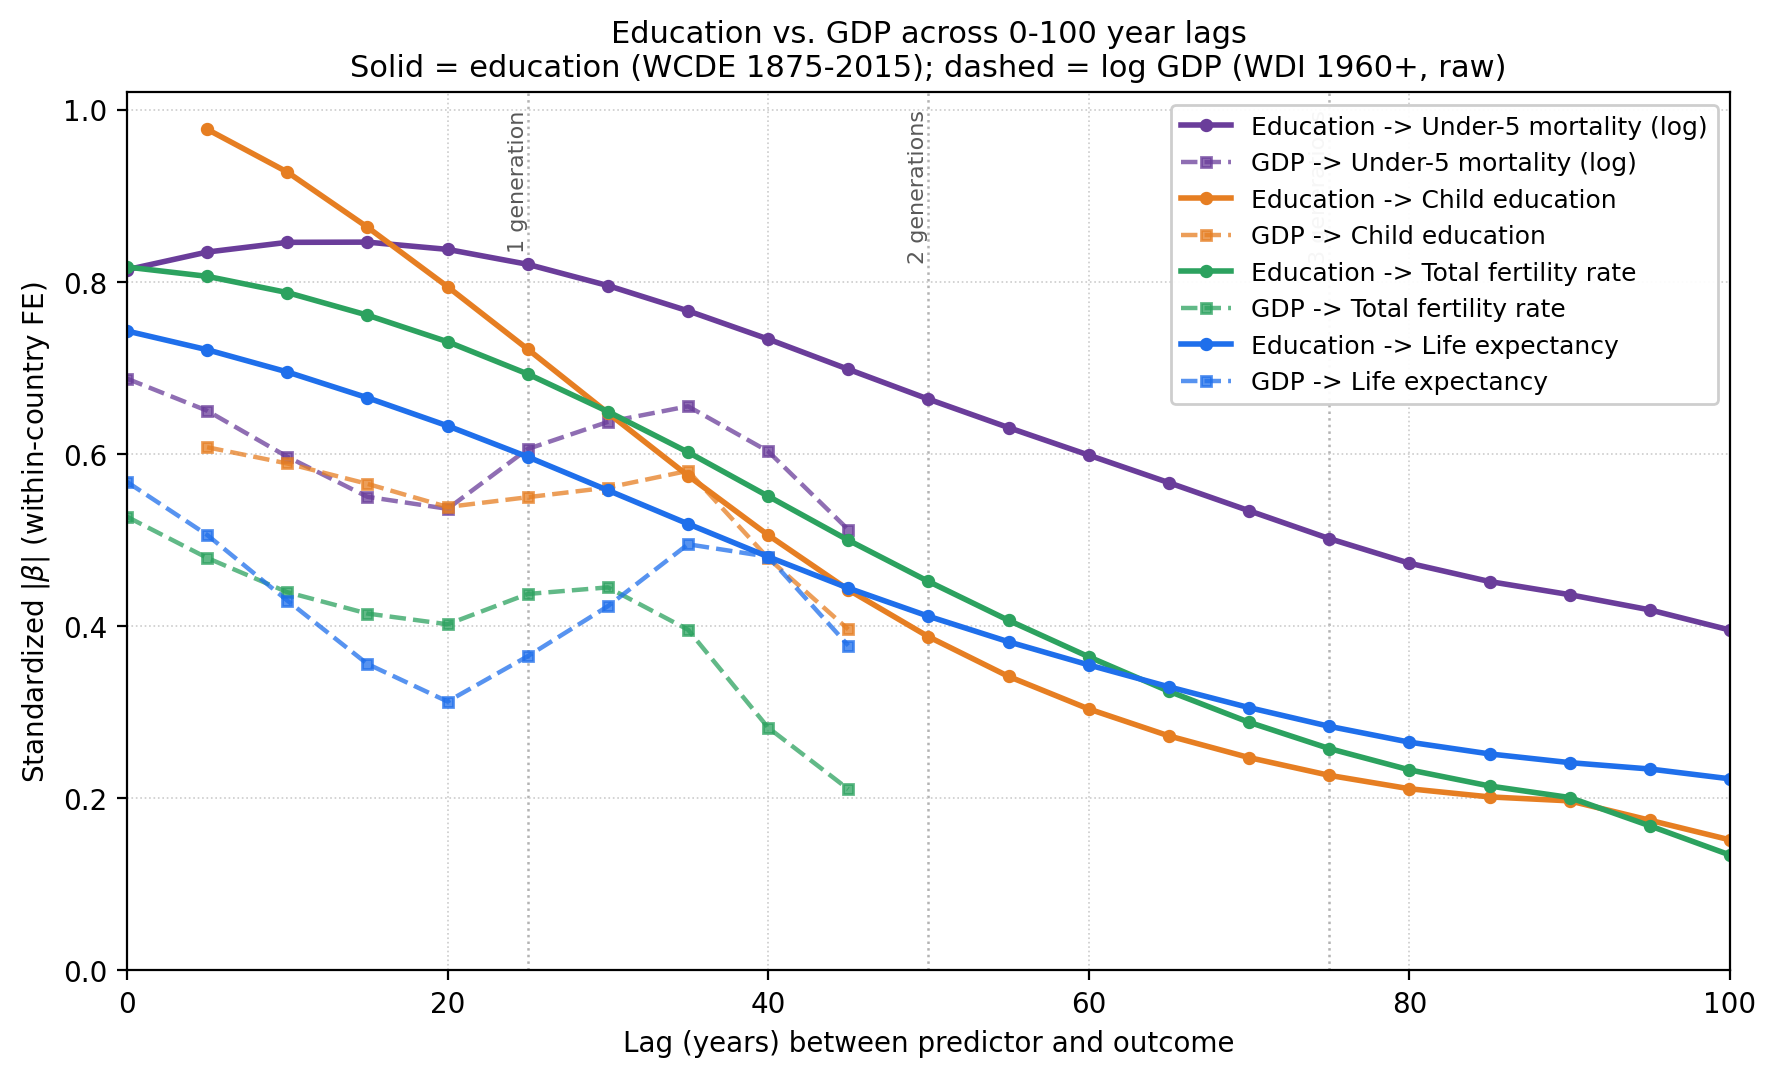
Income looks like it predicts development because education drives income. Strip out education's contribution, and what's left of income predicts almost nothing — on every outcome.
Take each country's income, remove the part that education explains, and use what remains to predict outcomes 28 years later. What remains predicts almost nothing. The signal that looked like income was education moving through it.
What predicts development one generation forward?
How much of the variation does each explain? (Income measured after removing education's contribution)
Children
per woman
Education
Each country compared only to its own past, 130+ countries, 1960–2015. Income measured after removing education's contribution.
Income's numbers are so small they could be zero — no meaningful predictive power.
These numbers come from comparing each country to itself over time — not comparing rich countries to poor ones. The method controls for everything permanent about a country: its geography, culture, colonial history, institutions. What's left is change over time. And the change is driven by education.
The part of income that has nothing to do with education explains under 2% of variation on every development outcome — life expectancy, fertility, the next generation's education, child survival. Income is downstream. Education is the cause.
This holds at every education level (primary, lower secondary, upper secondary), every time lag (15 to 30 years), and with girls' education specifically. Educated mothers are even stronger predictors than the population average — the mechanism runs through families, not economies.
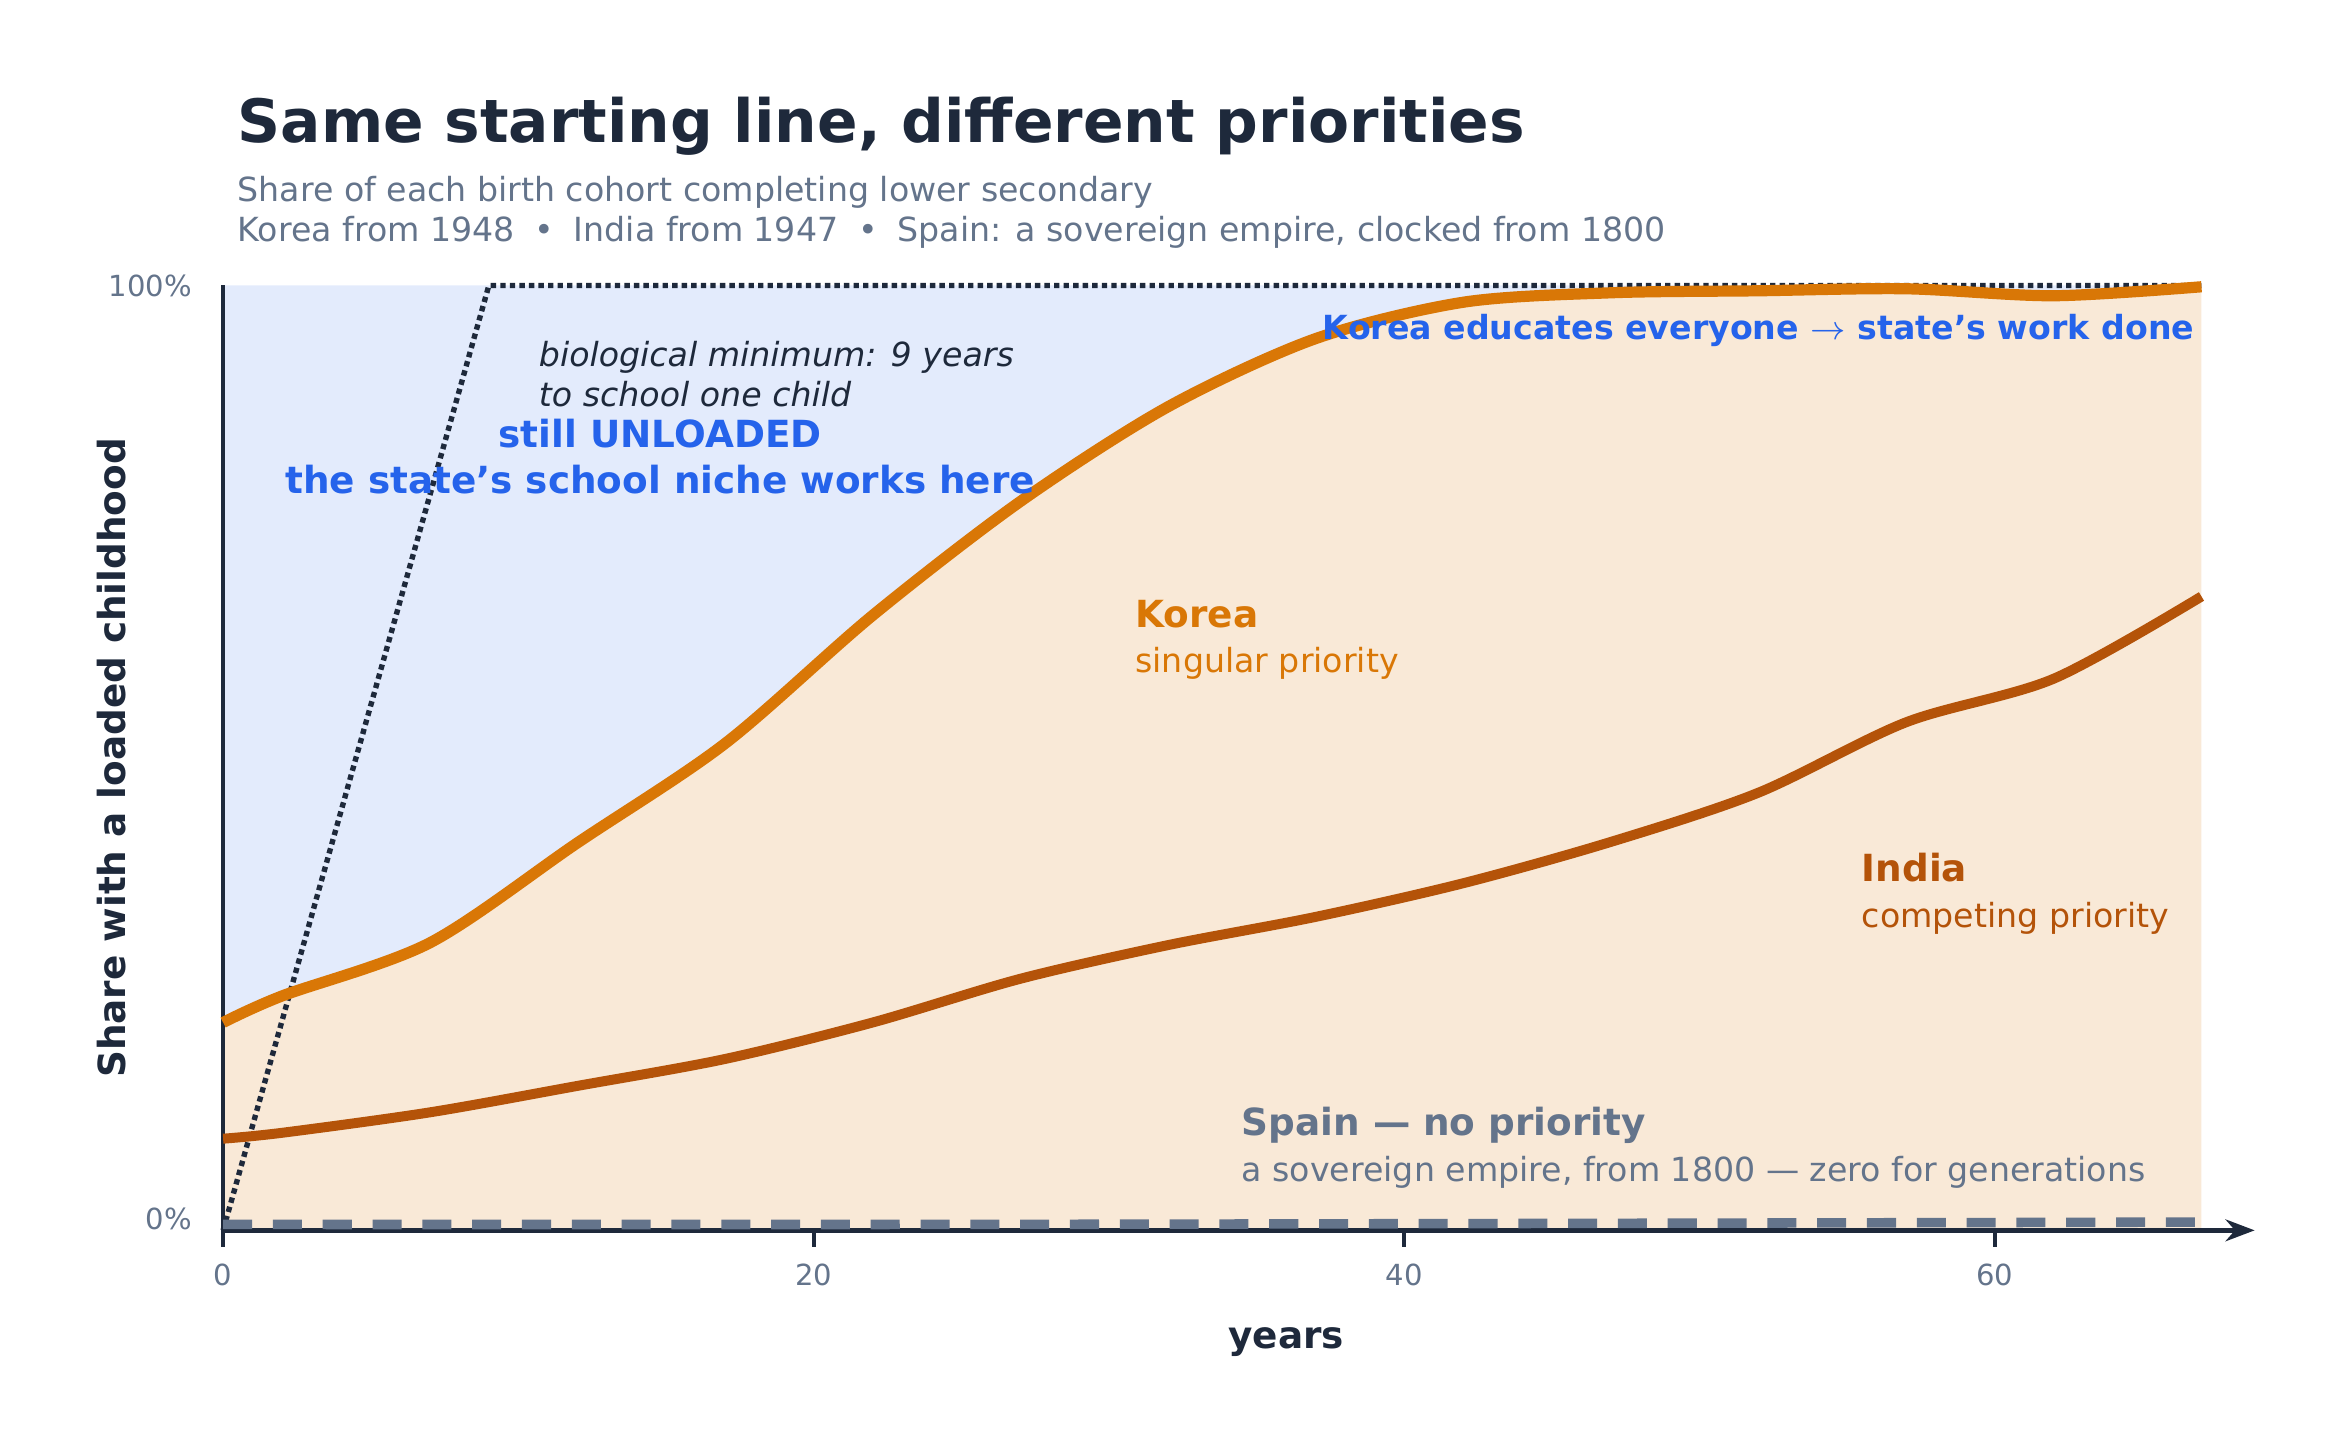
Here is the sharpest form of the same fact. If income bought education, the income a country needs to reach a given schooling level would be a stable price. It is not — it collapses. To school half a cohort through lower secondary, the income required has fallen severalfold in constant dollars since 1960, and that is against global growth, which should have pushed it up. Measured against each era's world-median income the fall is far steeper: a country at that schooling level has moved from well above the typical country's income to below it. Poorer and poorer countries reach the same schooling decade after decade — impossible if income were the gate. Schooling spreads down the income ladder like a technology, not a purchase, which is why Korea, Cuba, Bangladesh, and Sri Lanka schooled their children while still poor. You do not need to get rich first.
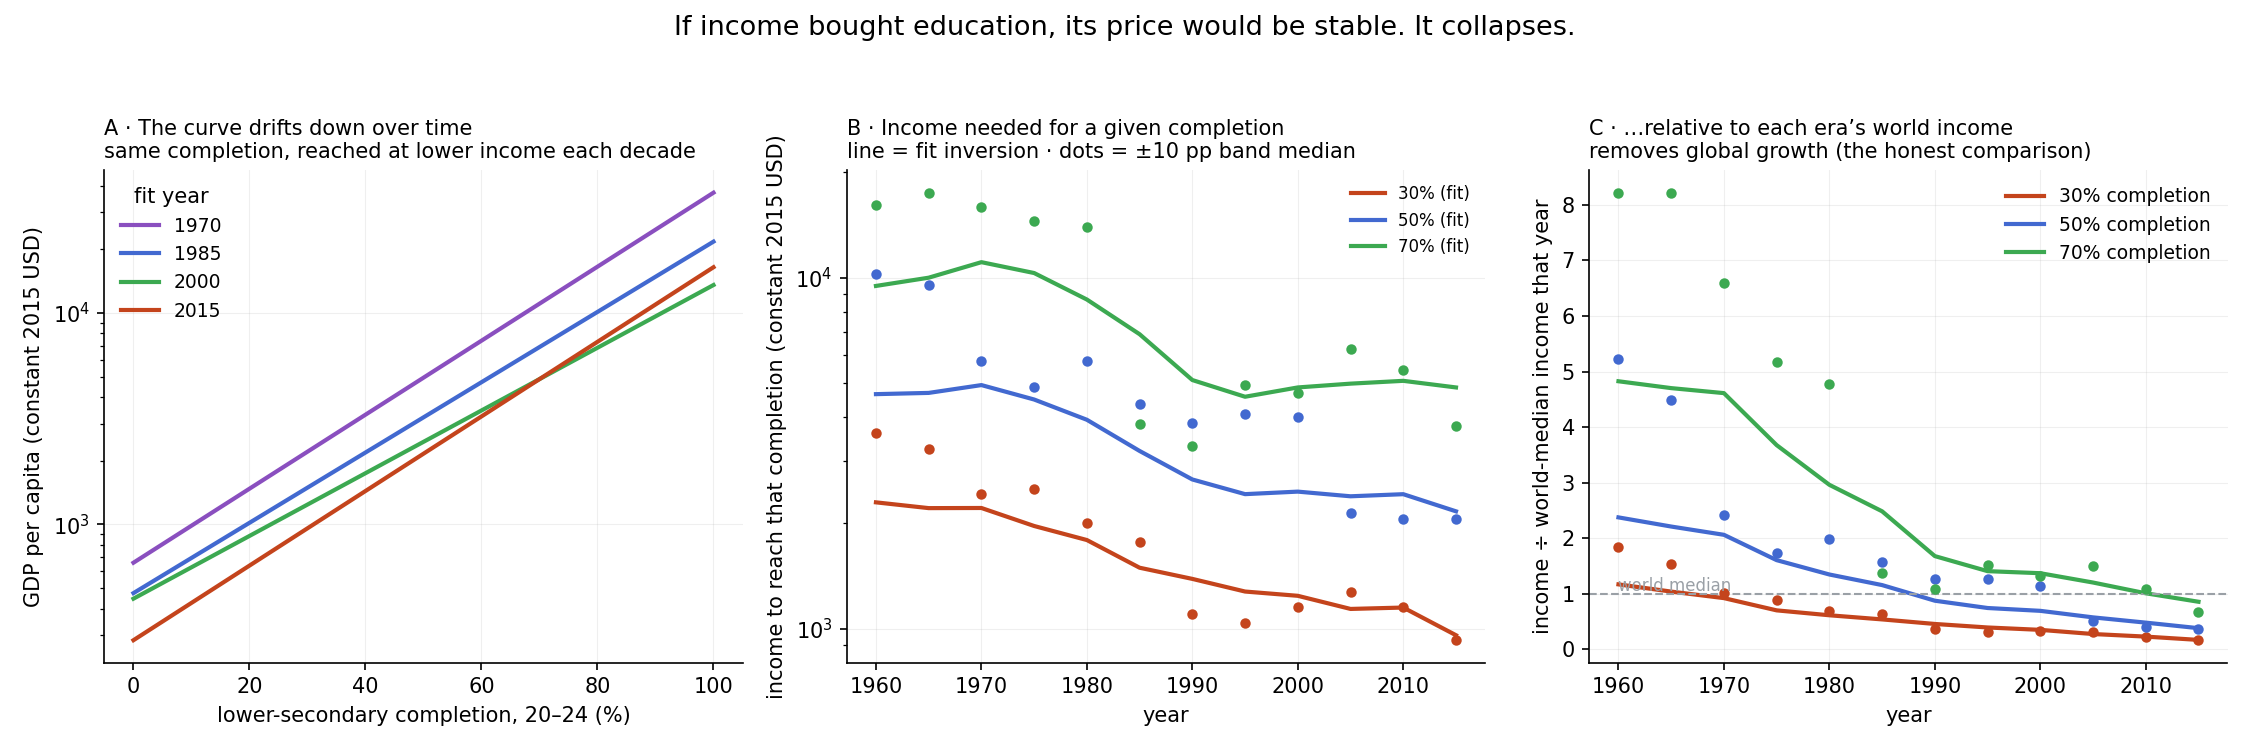
The price of education in income, over time. If income bought schooling this would be flat; instead the income to reach any given completion level collapses — poorer countries school their children each decade. (Source: author's calculation, World Bank WDI and WCDE v3.)